Library Data Dashboard
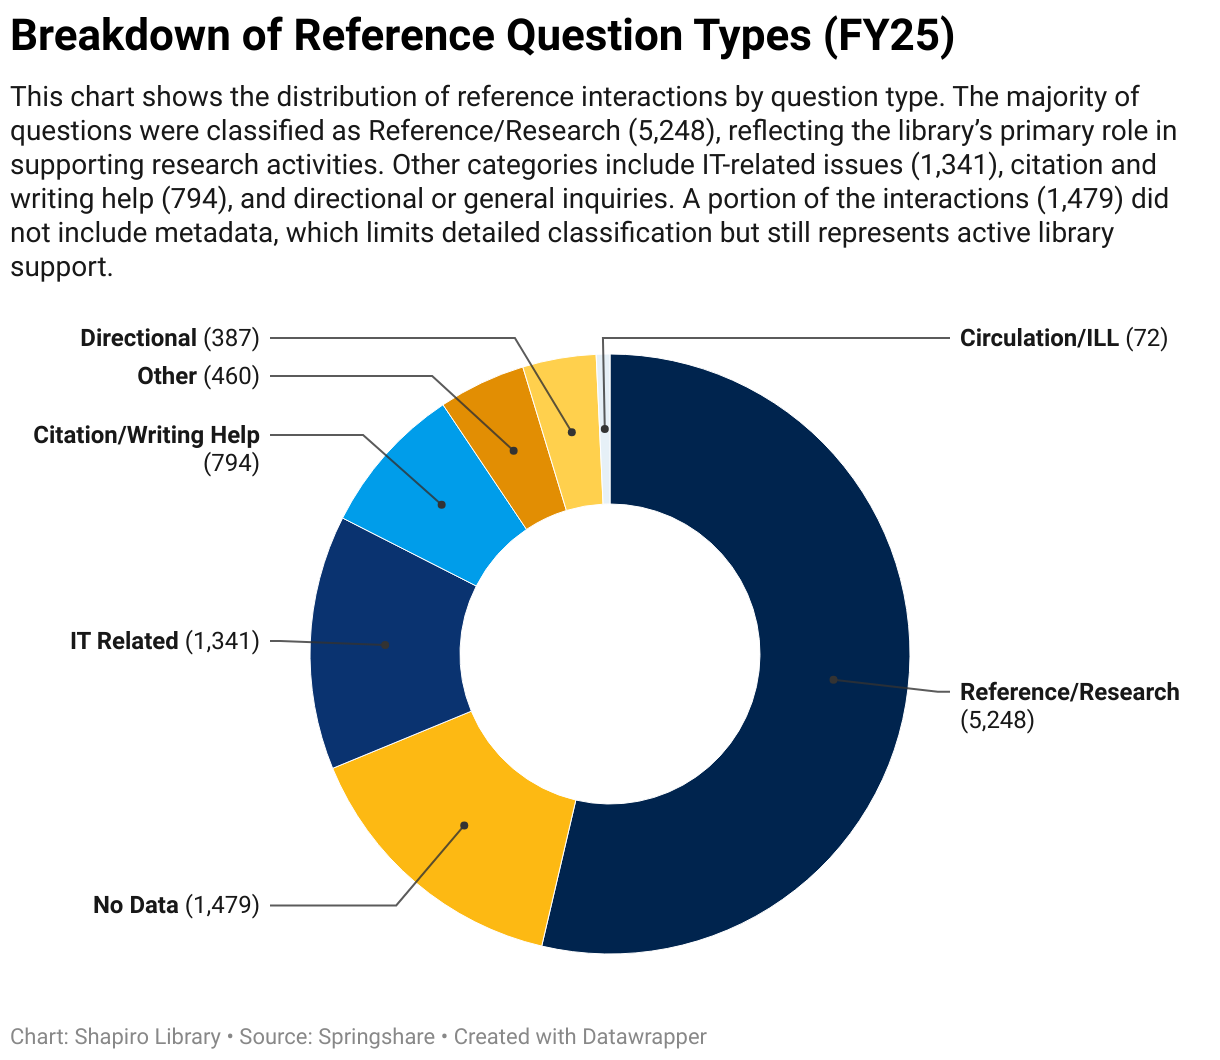
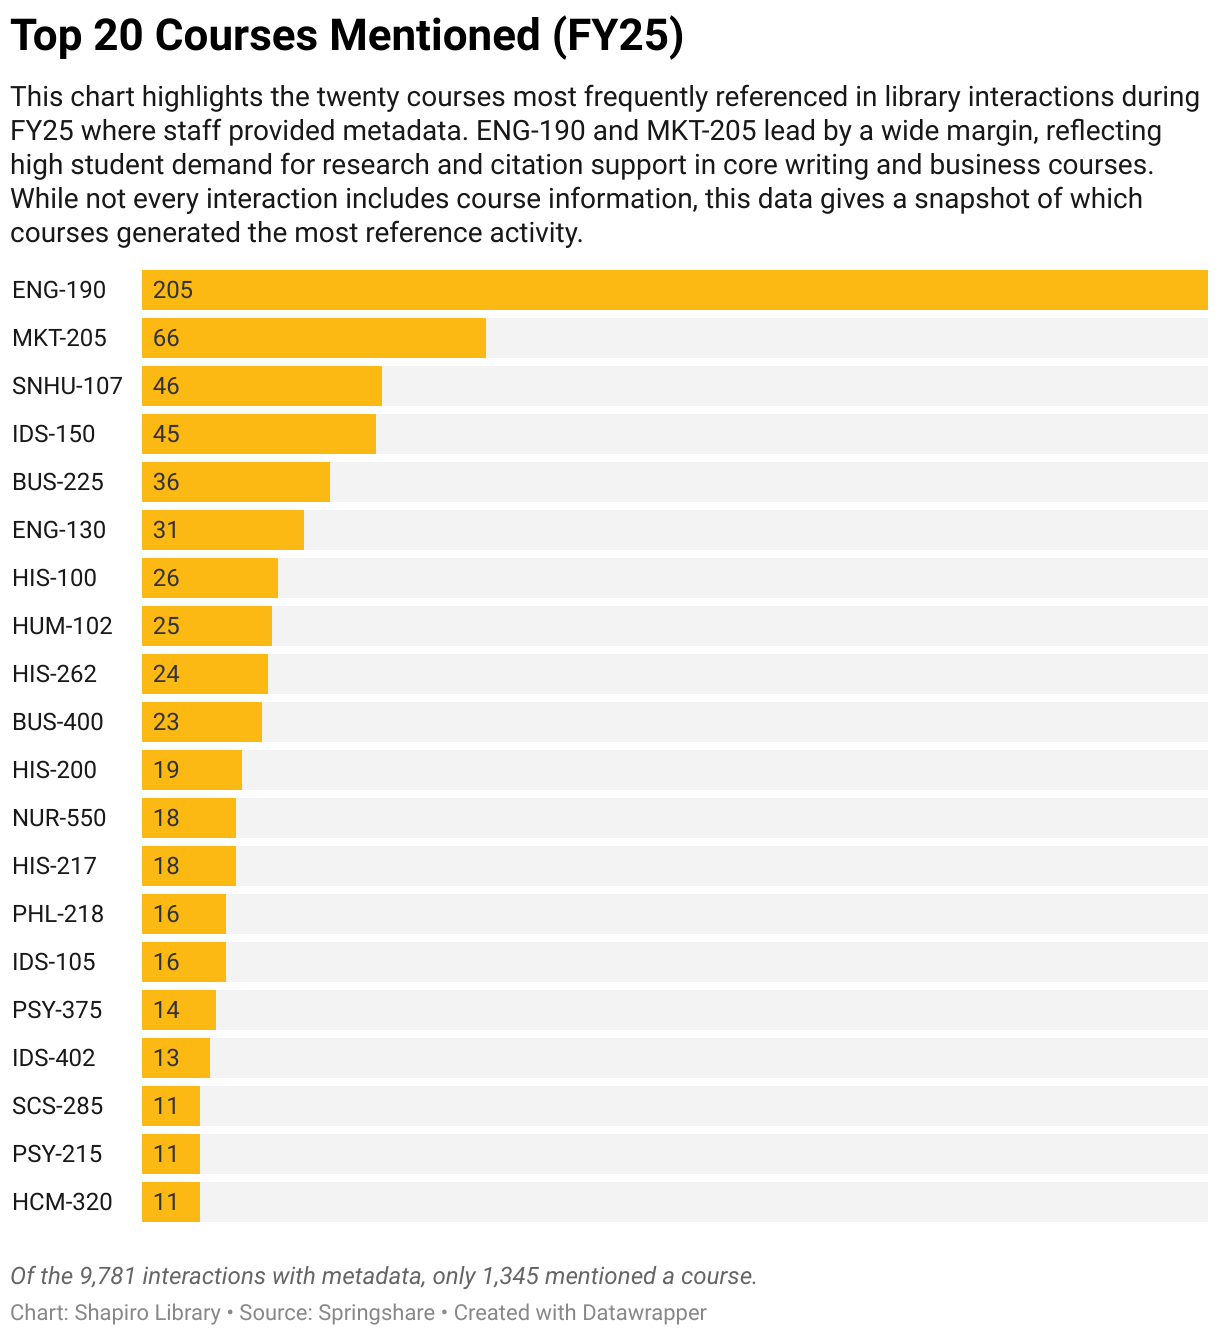
Reference Analytics provide deeper insight into the types of questions students bring to the library. While not every chat or ticket includes staff-coded metadata, roughly half do, giving us a representative view of user needs. This data helps identify the most common question categories, measure the complexity of interactions through READ scores, and highlight the courses most frequently connected to research help requests. These details support service improvements and guide instructional outreach.
Important Note: Only interactions with completed staff coding are included in these analytics. Counts may differ from total chat/ticket volumes shown on the Reference Interactions page.
Overview
Interactions with Analytics (FY25)
9,781
Chats + tickets that include staff-coded metadata
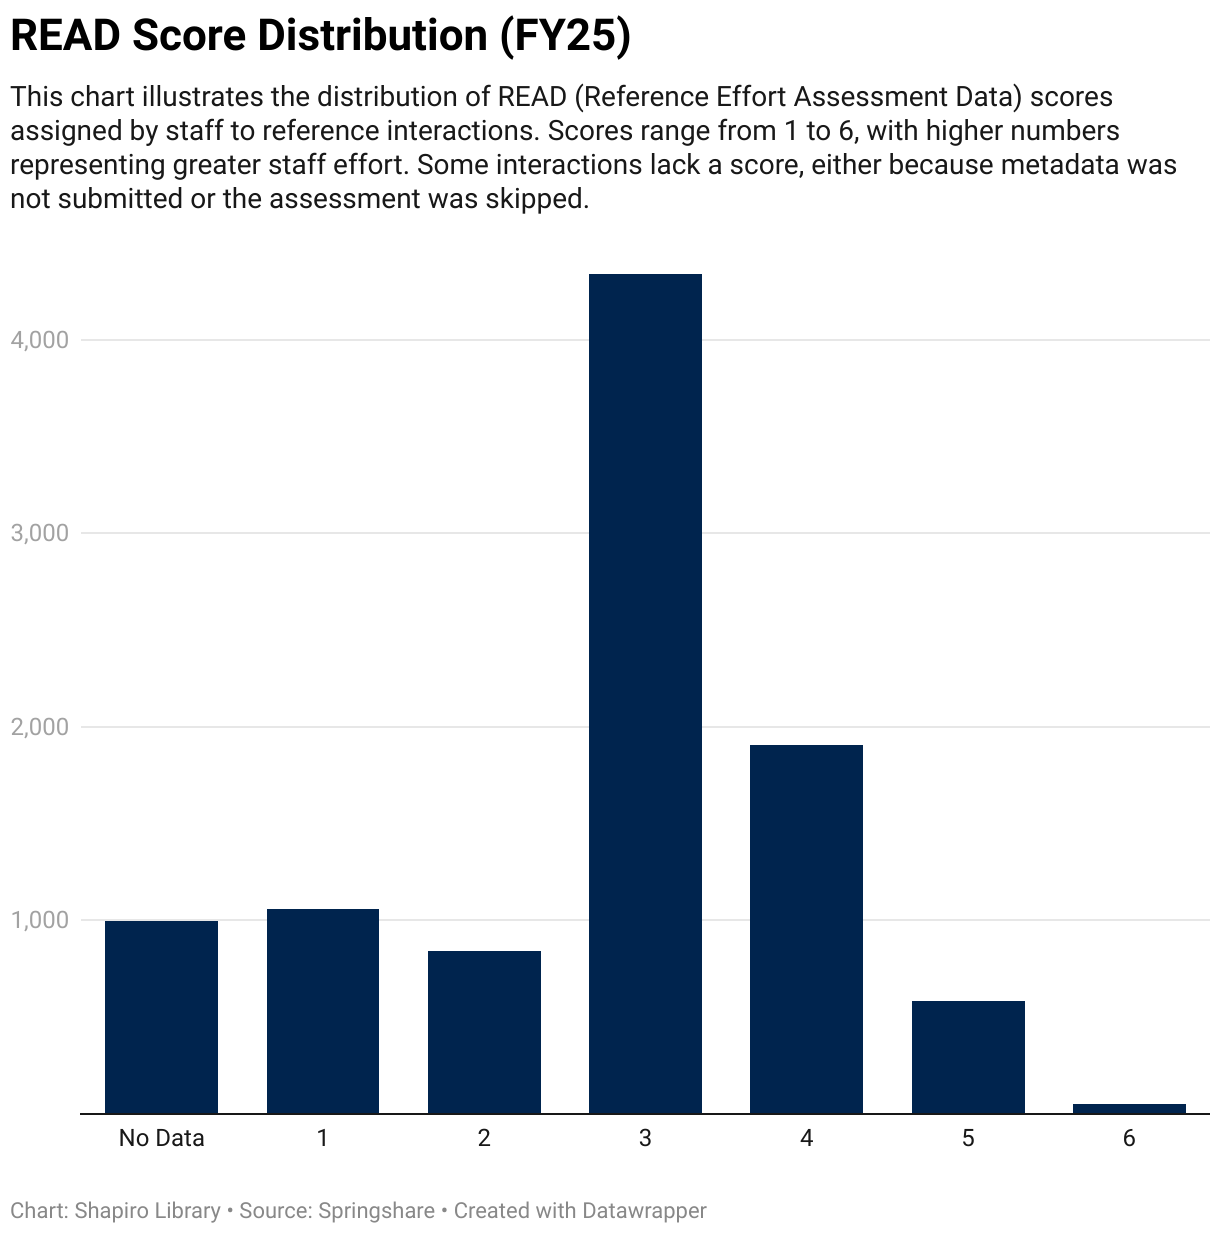
READ score (1–6): Staff assign a READ score to each coded interaction to indicate its complexity. 1 = directional/quick answers; 2 = simple factual questions; 3 = guidance requiring some explanation; 4 = instructional help with resources/strategies; 5 = advanced research requiring multiple steps or sources; 6 = intensive research consultation or project-level support.