Library Data Dashboard
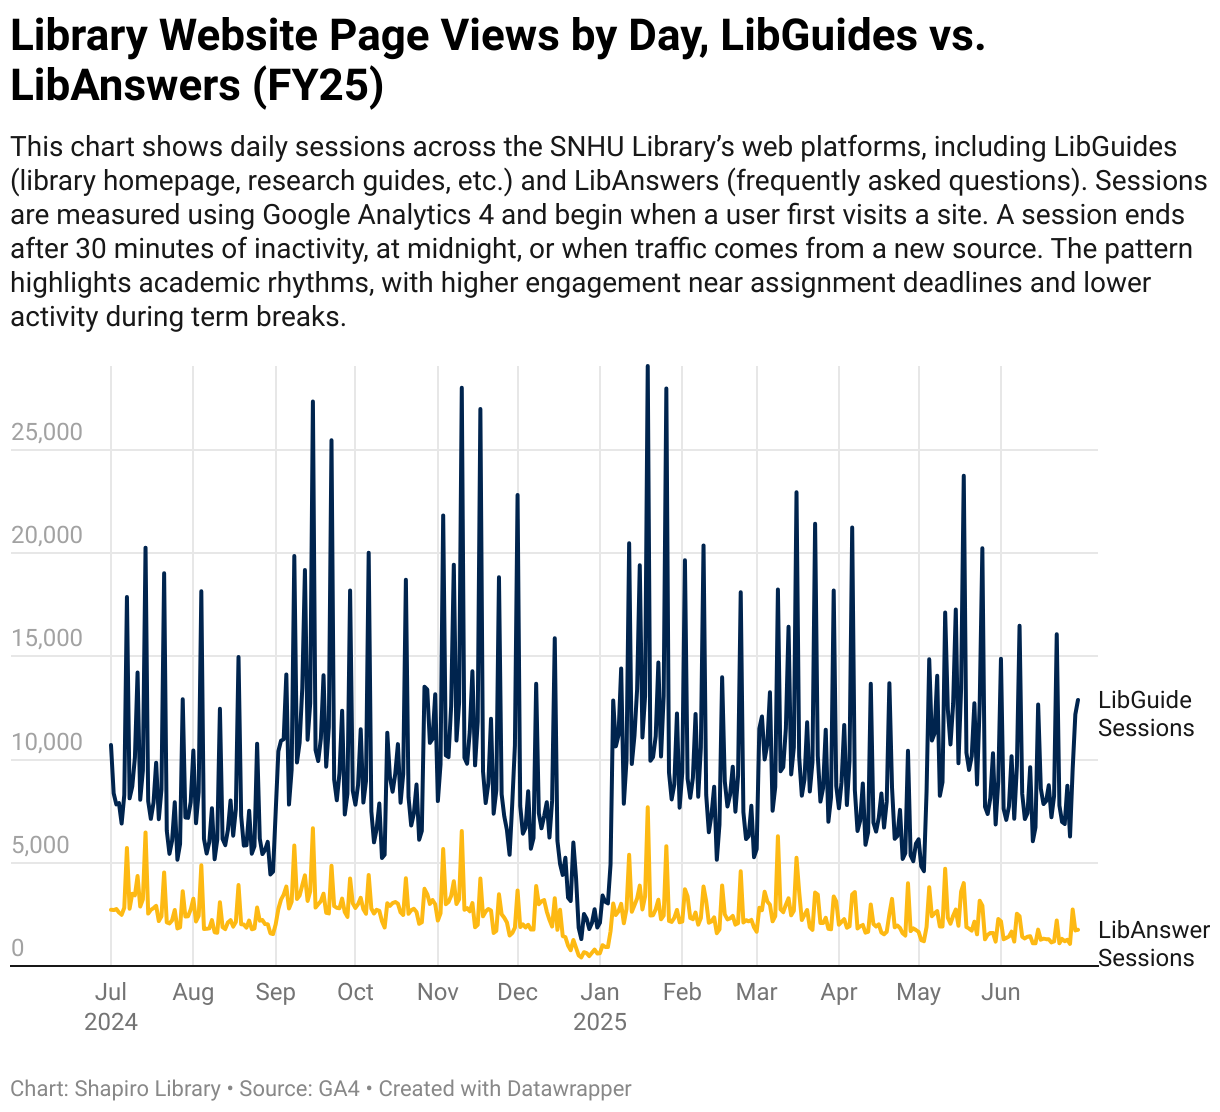
The Website Traffic section provides insight into how users interact with library-managed websites, including LibGuides and LibAnswers. Data is collected through GA4 and Springshare reporting, offering a comprehensive look at both overall traffic patterns and the specific pages users engage with most. By examining site sessions, trends over time, and the most frequently visited pages, this section highlights how learners, faculty, and staff access research support, course guides, and frequently asked questions. These patterns can reveal seasonal peaks around academic deadlines and areas where the library’s online presence is most relied upon.
Total LibGuide Sessions (FY25)
3,558,981
Total LibAnswer Sessions (FY25)
915,346